


Wall Street futures rose for a third day on Tuesday as weak US data boosted expectations of a December Fed cut. ADP payrolls contracted for a third month, consumer confidence slipped to a six-month low and both producer prices and retail sales softened. With the backlog of US data now being released, the picture points to an economy slowing enough to justify Fed cuts without flashing recession warnings — a combination that has supported risk appetite.
Separately, US Medicare has negotiated a 36% price cut across 15 drugs, though the discounts will not take effect until 2027. Still, the move will ultimately squeeze big-pharma profit margins.
View related analysis:
- Nasdaq 100 Lags Dow Jones: Divergent Signals Among Nvidia, Apple, Meta
- Nasdaq 100 Outlook: Thanksgiving Seasonality and Volatility Trends
- Nvidia (NVDA) Earnings Stats for Nasdaq 100 Traders
- Nasdaq Leads Wall Street Lower: Tesla Turns, Apple Sours
Nasdaq 100 Leads as Rate-Cut Hopes Lift Tech Sectors
Wall Street futures rose for a third day on Tuesday as weak US data boosted expectations of a December Fed cut. ADP payrolls contracted for a third month, consumer confidence slipped to a six-month low and both producer prices and retail sales softened. With the backlog of US data now being released, the picture points to an economy slowing enough to justify Fed cuts without flashing recession warnings — a combination that has supported risk appetite.
Separately, US Medicare have negotiated lower the price of 15 drugs by 36%, though the discounts will not arrive until 2027. Still, it will eat into the profit margin of big pharma.
Charts prepared by Matt Simpson, Source: LSEG
Semiconductors and AI Indices Outperform into Mid-Week
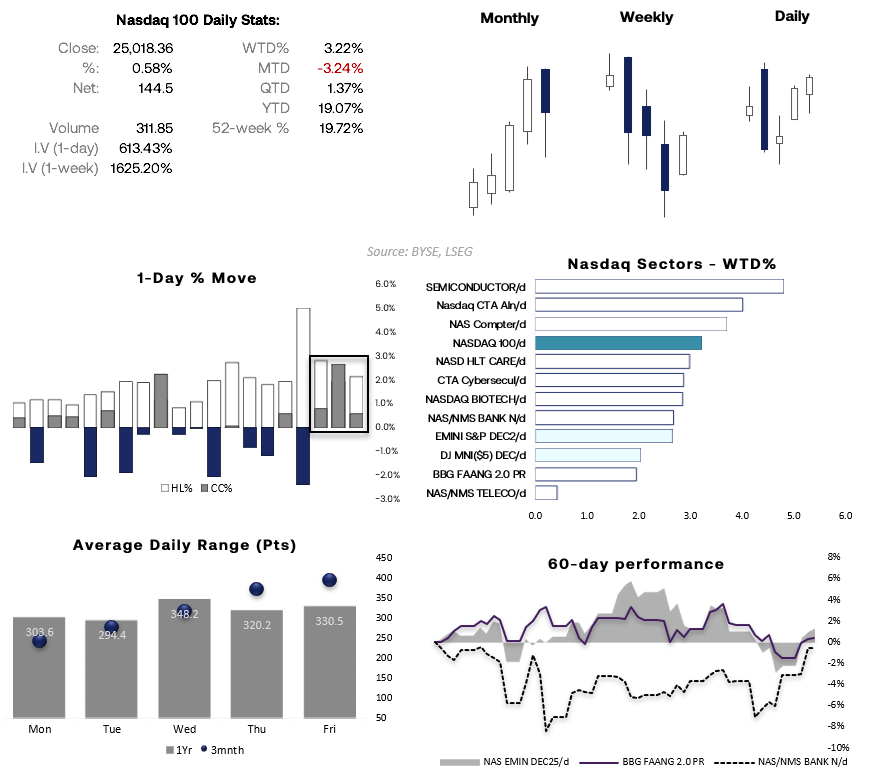
The Nasdaq 100 continues to lead the S&P 500 and Dow Jones off recent cycle lows. Semiconductors (SOX), Nasdaq AI and computer indices are outperforming the broader Nasdaq this week, suggesting that worries of an AI-bubble unwind have eased on the prospect of lower rates. The Bloomberg FAANG 2.0 index is also higher, though it still lags the Nasdaq Banks Index, the S&P 500 and the Dow Jones.
The Nasdaq 100 is now trading above last week’s open, putting it in a position to snap a three-week losing streak. But unless it can print a fresh record high by month-end, it remains on track to form a bearish outside candle. This week’s bounce has been welcome for bulls, but it doesn’t remove the broader downside risks.
Wednesday has delivered the largest average daily range over the past year at 384.2 points. Over the past three months, volatility has tended to rise progressively through the week, peaking on Friday.

Nasdaq 100 Ratio Analysis: Semiconductors (SOX), Nvidia (NVDA)
Nasdaq futures rose for a fourth straight session in early Asian trade. The recent highs at 25,310 and 25,361 are within easy reach, but the next meaningful resistance sits at the monthly pivot (25,520). A break above that level brings the 25,830 swing high into view.
The SOX/Nasdaq ratio is trying to turn higher, hinting at a possible return of semiconductor leadership, but the move looks unconvincing. If semiconductors fail to extend their rebound, the Nasdaq may struggle to push to new highs in the near term. Nvidia (NVDA), once the index’s key driver, is also showing limited bullish follow-through. Together, these signals suggest bulls face a more uncertain path unless they can rely on a typical mid-December “Santa rally”.

Chart analysis by Matt Simpson - data source: NYSE, TradingView
Meta Platforms (META) Technical Analysis
On 12 November I flagged Meta as a potentially oversold stock. It had already suffered heavy losses from its highs, yet failed to push lower despite the broader selloff on Wall Street — a sign it was primed for a rebound if sentiment improved.
Sentiment has since turned, and Meta is now up around 7% from last week’s close. I didn’t catch the exact low, but price action chopped around the 600 level in a tight range before bullish range expansion arrived on Monday and Tuesday. The weekly RSI(2) was extremely oversold into last week’s close, and daily volumes are now rising alongside prices.

We’ve also seen Meta gap higher on two consecutive sessions following a tight bearish consolidation. That pattern often develops into a breakaway gap, which can form near significant lows.
Meta remains on my bullish watchlist and is a stock that could continue to attract dip buyers while sentiment stays constructive on Wall Street. Bulls may look for dips towards gap support, targeting 680 initially, with 700 and the 715 VPOC coming into play above that.
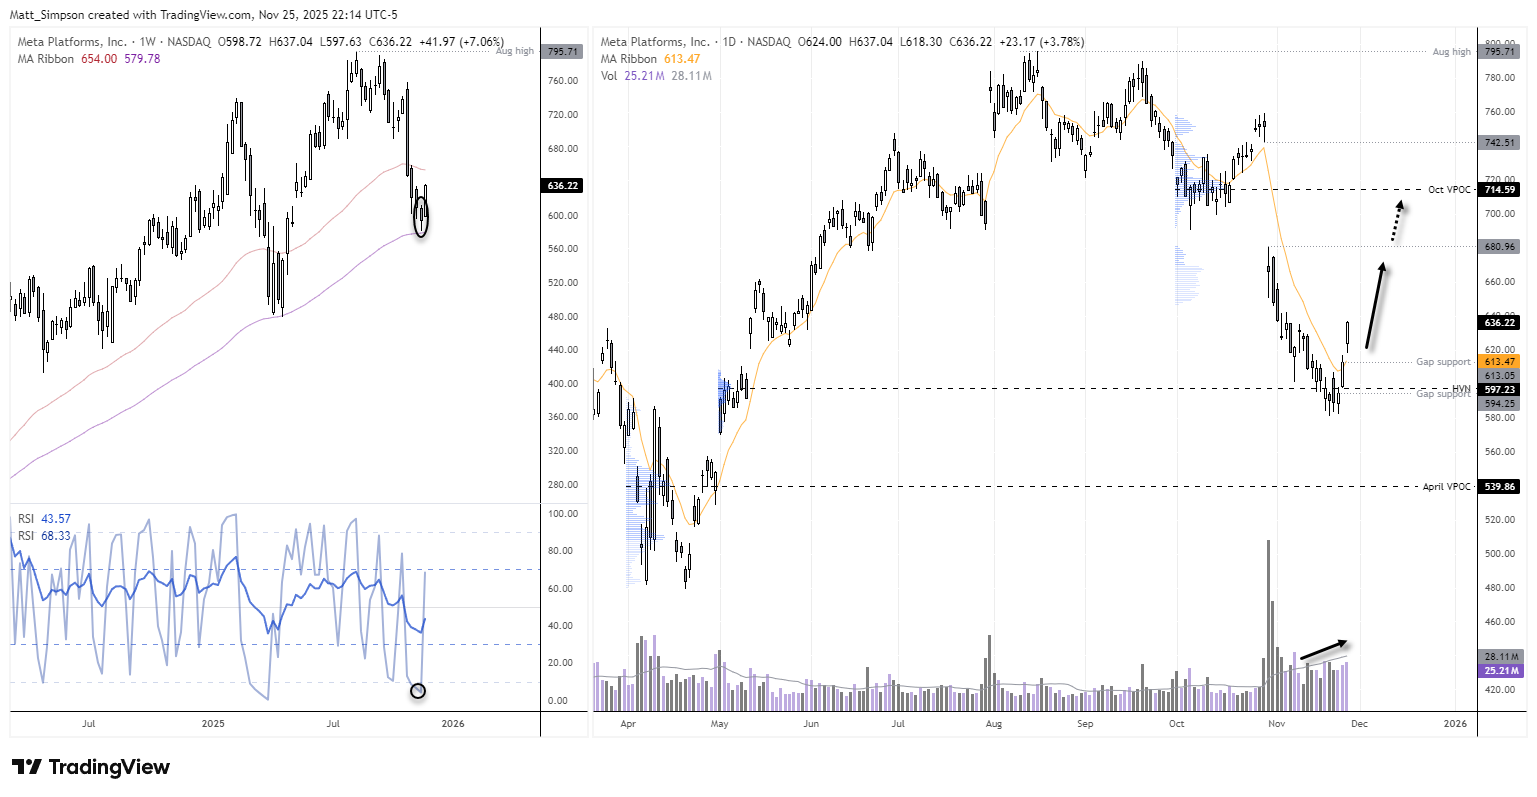
Chart analysis by Matt Simpson - data source: NYSE, TradingView
View the full economic calendar
-- Written by Matt Simpson
Follow Matt on Twitter @cLeverEdge
How to trade with City Index
You can trade with City Index by following these four easy steps:
- Open an account, or log in if you’re already a customer
• Open an account in the UK
• Open an account in Australia
• Open an account in Singapore
- Search for the market you want to trade in our award-winning platform
- Choose your position and size, and your stop and limit levels
- Place the trade


